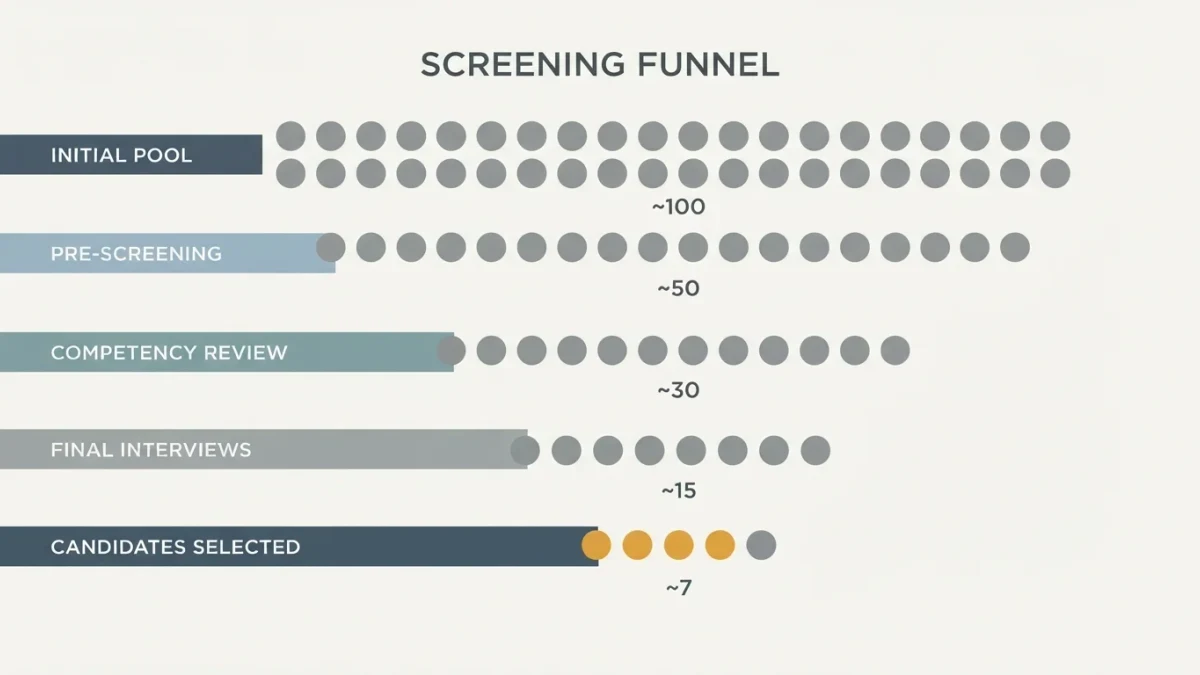
A stock screener filters the universe — thousands of listed US companies — down to names matching rules you set: a price-to-earnings ratio under 20, debt below 2x EBITDA, margins rising for three years. The tool's honest job is narrowing the reading list from 5,000 companies to 20; it cannot rank quality, and backtests built on screens systematically overstate future returns because filters selected on past data inherit that past. NewsJay publishes information and education, not investment advice, and no screen output is a buy list.
What can a screener actually filter on?
Four families of criteria. Valuation: P/E, price-to-book, EV/EBITDA, dividend yield. Quality: margins, return on equity, debt-to-equity, cash flow conversion. Growth and momentum: revenue and earnings growth rates, price trends. Technical and size: market capitalization, trading volume, distance from highs. The order matters: quality filters first remove fragile companies, valuation second prices what survives, and growth third tests whether the price is explained — rather than stacking all three into a machine that outputs one magic name.
What does a sensible first screen look like?
Below is a worked example of a beginner quality-value screen, with thresholds that are conventions rather than truths.
| Filter | Threshold | Reason |
|---|---|---|
| Market capitalization | Above $2 billion | Drops micro-caps with thin reporting |
| Return on equity | Above 12% | Capital competence screen |
| Debt to equity | Below 1.0 | Removes leverage-dependent businesses |
| P/E vs sector | Below sector median | Prices the survivors modestly |
| Positive free cash flow | Yes | Earnings confirmed in cash |
Run honestly, such a screen returns dozens of names — and that is the correct output. A screen returning five names is either trivially narrow or curve-fit.
How do screeners mislead?
Three traps recur. Survivorship: screens see today's listed companies, not the failures that delisted, quietly inflating historical performance of any filter. Data lag and restatements: ratios update on filings schedules, and screens run after earnings season see different companies than screens run before. Selection on outcomes: filters tuned until the backtest shines have memorized history rather than learned markets — the more criteria tuned, the more certainly the result is fiction. The professional habit is few filters, wide bands, and acceptance that a screen is a library card, not a verdict.
What happens after the screen?
The reading — which the screen cannot do. Each survivor gets the five-question checklist a separate analysis covers: business model in one sentence, revenue quality, debt schedule, competitive position, valuation against history. Most survivors fail this read, which is fine: a screen that sends ten companies to reading and yields one worth following has done its job. The investors the tool serves worst are those who treat its output as complete.
Where do screeners live?
Every major brokerage platform includes one free; specialized services add depth at subscription prices. Screeners differ mainly in data coverage and universe — US-only versus global, common stocks versus ADRs — so the first settings worth checking are universe definitions, not filter cleverness. The SEC's EDGAR remains the anchor source for verifying any figure a screen returns.
How do you build a screen from a thesis instead of a template?
The screens that earn their output start from a sentence: the investor writes what they are looking for — durable companies temporarily out of favor, or steady compounders held by insiders — and only then chooses the three or four filters that operationalize the sentence. The discipline prevents both failure modes: template screens that embody someone else's thesis, and kitchen-sink screens with ten criteria whose backtest exists only because the past was tuned until it agreed. A sentence with three filters also fails honestly — returning nothing in the current market — which a tuned monster never does.
What is the honest way to test a screen?
Split the past: build the screen on data through one date, run it forward on data after that date, and never adjust the filters once the test starts — the same out-of-sample respect demanded of any model. Then ask the boring questions: how many names does it return, how concentrated are they, what did the worst year look like, and would the investor have actually held the names through it. A screen that survives all four answers with its thesis intact has earned a small allocation of confidence; one that survives only on paper has earned nothing.
What belongs in the reading after the screen?
The filings the ratios summarize: the 10-K's business description for the one-sentence test, the debt schedule behind the leverage number, the cash flow statement behind the earnings figure, and the risk factors section where management lists what could end the story. Fifteen minutes per survivor separates the screen's statistical survivors from companies a person can actually hold — and most survivors fail, which is the process working.
What is the honest alternative to screening — and when is it better?
The alternative method is reading industries rather than filtering universes: pick an industry, read its five or ten largest companies' filings in sequence, and build the comparison table by hand. The approach cannot scale to thousands of names and does not try to; its advantage is depth — the reader who has processed one industry's filings knows what normal looks like, carries the vocabulary, and recognizes the outlier when a screen eventually surfaces it. Screens and reading compose well: the filter narrows the universe, the industry method deepens the understanding, and most disciplined investors end up doing both in proportions that match their available time.
How do sector filters prevent accidental bets?
Running the same screen across the whole market quietly loads it with whichever sector the current moment favors — cheap cyclicals in a downturn, cheap banks after rate shocks — so the results arrive with a hidden factor bet attached. The discipline is running the screen per sector or capping names per sector, then asking whether the thesis was ever about the sector itself. The screener does not know it made a sector bet; the operator is the only one who can notice, which is why noticing belongs on the checklist.
FAQ
Can screening replace reading filings?
No. A screen summarizes ratios; a filing explains why the ratios look as they do — whether value is opportunity or accounting residue. Screens narrow; filings decide.
Why does my screen's backtest look amazing?
Almost certainly overfitting plus survivorship: criteria tuned on the same history they test, run over a universe that already excluded failures. Demand out-of-sample behavior before believing any backtest, especially your own.
What are preset screens good for?
Learning what other investors watch, and getting started faster. Their weakness is popularity — widely run presets get crowded into the same names. Treat presets as templates to edit, not strategies to adopt.
How often should I rerun screens?
Quarterly, after filings refresh, is plenty — the underlying businesses change at annual speed. Screens rerun weekly mostly rediscover the same names and add the temptation to trade the list's churn.