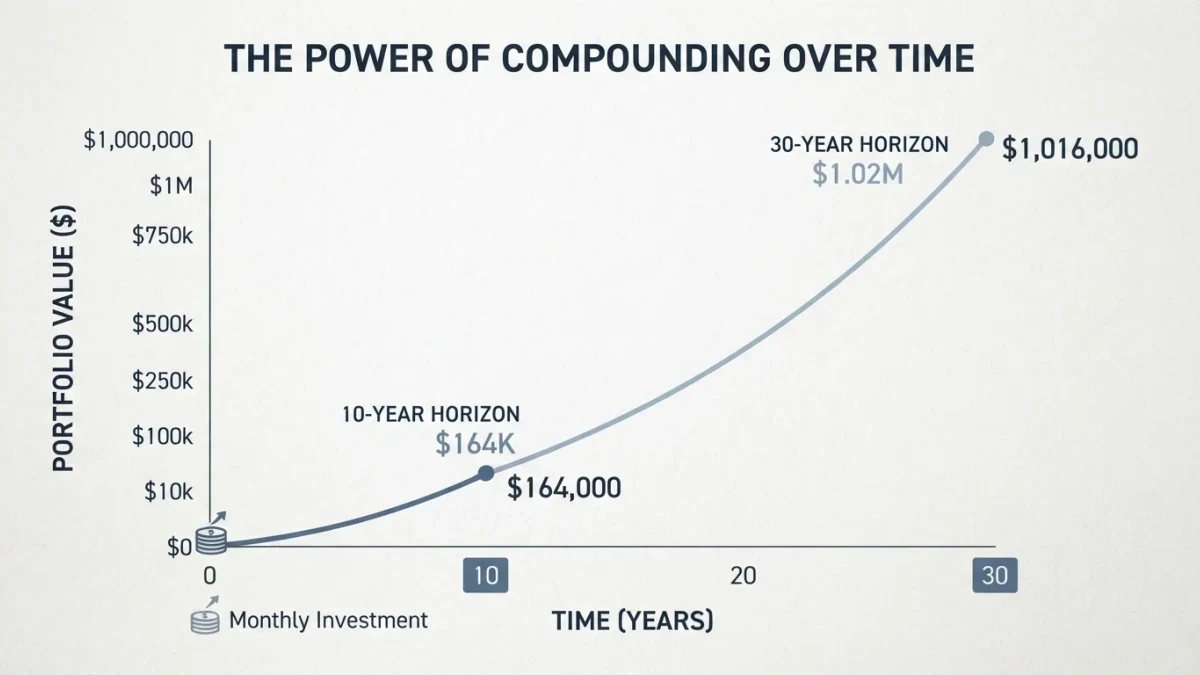

Compounding in a broad index fund is slow, then suddenly large: a hypothetical $10,000 growing at the S&P 500's long-run average of roughly 10% a year before inflation reaches about $26,000 after a decade, $67,000 after two, $174,000 after three — and $453,000 after four, the final decade alone adding more than the first three combined. All figures are hypothetical illustrations using the historical average from the SBBI data series since 1926; actual decades have varied enormously, and past averages never guarantee future ones. NewsJay publishes information and education, not investment advice.
Why does the curve bend upward?
Because growth accrues on growth. In the first years, contributions of new money dominate — the compounding of the existing balance is arithmetic trivia. Around the middle years, the balance's own earnings overtake fresh contributions, and the portfolio begins doing more work than the saver. By the final decades, the annual gain on the pile routinely exceeds anything the owner could add from income. The mechanism has an exact implication for behavior: interrupting the curve early — by selling, by stopping contributions, by timing — forfeits precisely the years that carry the bend.
What supplies the compounding inside an index fund?
Three streams, mechanically reinvested. Price appreciation of the underlying companies — earnings growth flowing through valuations. Dividends — roughly a third of the market's long-run total return — buying new shares automatically when reinvested. And the reinvestment of both during declines, when distributions buy shares at lower prices, quietly accumulating the positions the recovery rewards. The index wrapper adds no return of its own; it removes the frictions — fees, turnover, tax drag — that historically erode compounding in costlier vehicles.
What interrupts compounding in practice?
The record is specific. Selling during declines, which converts temporary losses into permanent ones and removes the shares the recovery would have multiplied. Market-timing absences — missing the handful of strongest days that cluster near the worst ones does documented damage to long-run outcomes. Fees — the 1% expense ratio examined elsewhere costs roughly a quarter of a forty-year outcome. And taxes — annual turnover in taxable accounts realizes gains decades early; index funds' minimal turnover exists precisely to protect the curve's later years.
What does a real historical example show?
Consider two hypothetical investors in 1986, each putting $10,000 into a broad US market index and reinvesting dividends. The one who held through the 1987 crash, the 2000-2002 bear, and 2008-2009 finished 2025 with well over $300,000, per the market's total-return record. The one who sold in each crash and re-entered a year later finished with a fraction of that — not from bad selection but from absence during the rebound bursts that carry the compounding. The difference between them is not visible in any single year; it is the cumulative price of interruption.
How does inflation modify the picture?
Subtract roughly 3 percentage points for the long-run historical average to state results in real purchasing power — the 10% market average is nearer 7% real. Real compounding is what funds retirements, and it bends upward identically; a 7% real rate still doubles purchasing power about every decade. Stating expectations in real terms also inoculates against the common error of reading the early years' small nominal gains as disappointment.
How do withdrawals reverse the mechanics?
Everything that runs forward runs backward under withdrawals: each distribution removes not just its dollars but all their future compounding, which is why sustainable withdrawal rates in the research cluster near 4% of a diversified portfolio — a level low enough that the remaining balance keeps compounding through most historical sequences. The sequence-of-returns problem is the withdrawal-era mirror of the accumulation curve: early losses paired with withdrawals hollow the base that recovery would have multiplied. The planning answers — a cash buffer of one to two years of spending, flexible spending rules, allocation that still holds growth assets — exist to protect the curve's shape when it matters most.
How do taxes and fees bend the curve for real investors?
The clean 10% historical average is a pre-fee, pre-tax, pre-inflation number, and each subtraction compounds at its own rate. Inflation's 3-point historical average comes off first and most reliably. Fees come off multiplicatively — a 0.05% fund surrenders a rounding error over forty years, while a 1% fund surrenders roughly a quarter of the final balance, the arithmetic examined elsewhere in this series. Taxes depend on account placement: inside tax-advantaged accounts the curve runs gross until withdrawal; in taxable accounts, dividend and turnover drag trims a fraction of a percent annually, minimized by the same low-turnover construction index funds already have. The investor who sees all three subtractions as part of the same curve manages them as one system.
Why does starting early dominate almost every other choice?
Because the curve's later years belong to whoever was present for its earlier ones: at the historical average, one dollar invested at 25 compounds to roughly nine by 65, while the same dollar at 45 reaches under three — the decade of delay costing more than most fee, tax, and selection decisions combined. The practical translation for a young saver is that the boring variables — contribution rate, starting now, keeping costs low — dominate everything an early portfolio can control, and that the exciting variables barely register until the balance gives them room. Compounding rewards patience mostly by making impatience expensive in arithmetic that only becomes visible later, which is why the habit is built on schedules rather than inspiration.
Can compounding work against an investor?
Yes — the same curve runs backward for costs: a 1% annual fee compounds into roughly a quarter of a forty-year outcome, and high-interest debt compounds against the borrower faster than markets compound for them, which is why paying it off outranks investing. The mechanic is indifferent to direction; the investor chooses which side of it to stand on by choosing fees, debts, and schedule. Seeing compounding as arithmetic rather than magic is also protective: it explains why no legal investment doubles quickly, and why anything promising to is priced accordingly.
FAQ
How long before compounding becomes noticeable?
Rule of thumb: contributions dominate for roughly the first decade, the balance catches up near the second. The psychological hazard is that the curve looks unimpressive exactly when quitting does the most damage.
Does compounding work in down markets?
Continued contributions and reinvested dividends do — they accumulate shares at lower prices. Compounding suspends only when shares are sold or distributions are taken as cash; the market's declines are when the mechanism quietly prepares the recovery.
What return should I assume for planning?
Conservative planning uses historical real returns of 5-7% for broad equity, lower for balanced allocations — and tests the plan against weaker decades. Assumptions are inputs to be stress-tested, not entitlements.
Do I need to do anything to keep it working?
Three things only: keep contributions arriving, keep reinvestment automatic, keep costs near index levels. Every documented improvement in long-run outcomes traces to those mechanics; almost every documented failure traces to breaking one.