Two bonds can look identical on a quote screen and still behave very differently. Both may pay interest twice a year, and both may promise to return your money on a stated date. When interest rates move, one may barely twitch while the other lurches. Duration is the measure that explains the gap.
This guide explains what duration measures, where the seesaw picture comes from, and why the simple version bends when rates move by more than a little. No formulas are needed, just one idea borrowed from physics: balance points.
What Duration Actually Measures
In finance, duration measures how the price of a fixed-income instrument responds to a change in interest rates. The standard reference on bond duration notes that it is used to compare rate risk across bonds and to construct hedges. The larger the duration, the more a bond's price tends to move for a given shift in rates.
That makes duration a risk dial rather than a calendar entry. A bond's maturity tells you when the last payment arrives. Its duration tells you how exposed you are along the way, before that date ever comes.
The Seesaw Picture
The clearest mental picture comes from a long plank balanced on a single support. Each future cash payment is a small weight placed on the plank at its date, and heavier weights belong to payments worth more today. Slide the support until the plank balances, and that balance point is the bond's duration in time. For related coverage, see Market Caps Explained: Large, Mid, and Small Cap Differences.
Move most of the weight toward the far end, and the balance point travels away from today. That bond is more sensitive to a change in yields. Pile the weight near the start, through high coupons or a short maturity, and the balance point moves in. Sensitivity falls.
Two Names Worth Knowing
Frederick Macaulay set out the idea in a 1938 research study, defining a time-weighted average of the present values of a bond's cash flows. The measure still carries his name. Macaulay duration links payment timing to interest-rate risk, and it is the balance point in the plank picture.
A second measure, modified duration, turns the picture into a price estimate. It expresses the first-order percentage change in price for a small change in yield. Traders also track the price change per basis point of yield, a figure that travels under shorthand names such as DV01.
What Pushes Duration Up or Down
- Longer waits for cash: money promised far in the future puts weight at the far end of the plank.
- Bigger coupons: early payments pull weight toward today and steady the price.
- Embedded options: when cash flows depend on rates themselves, standard duration needs adjustment, and practitioners turn to option-adjusted measures.
Where the Simple Picture Bends
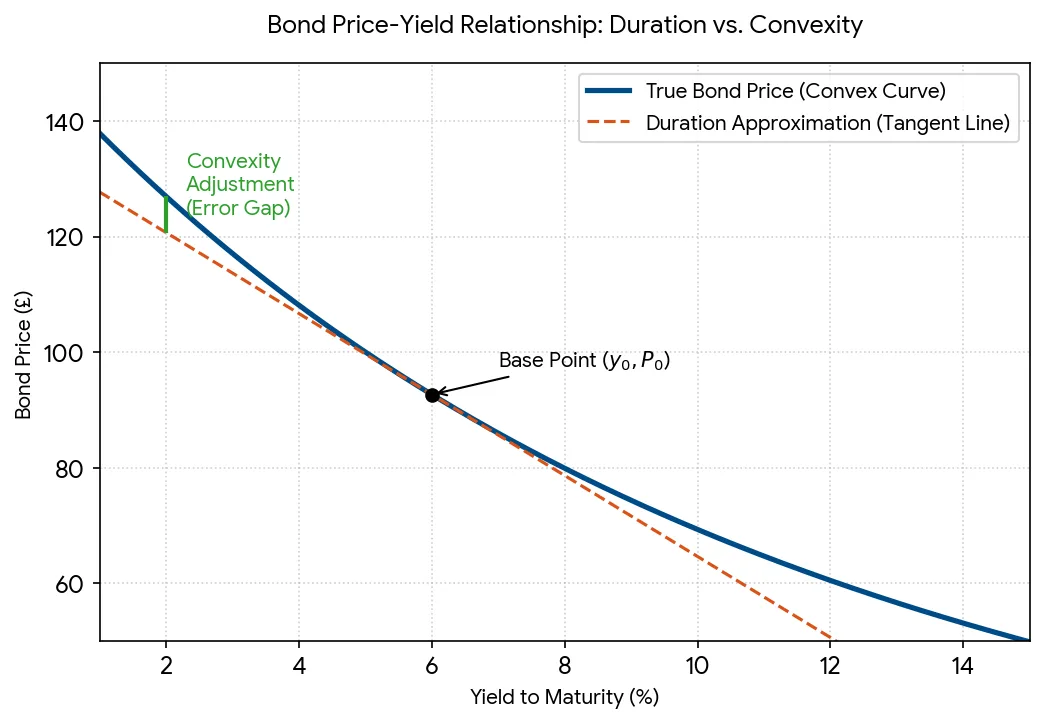
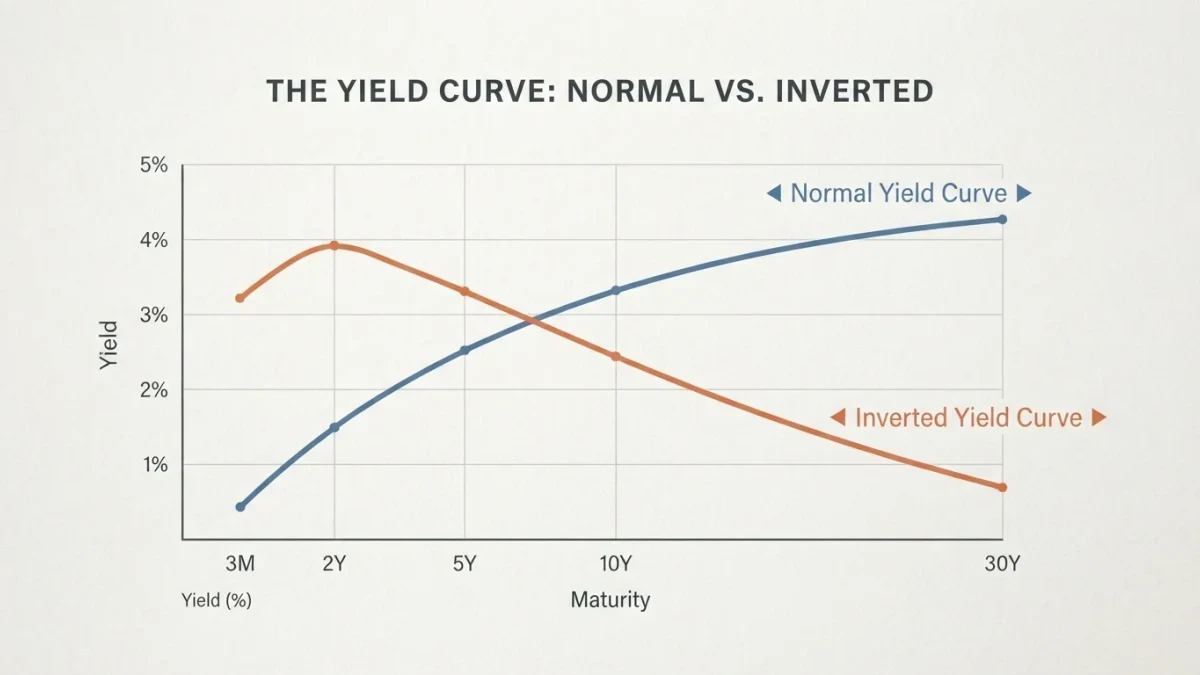
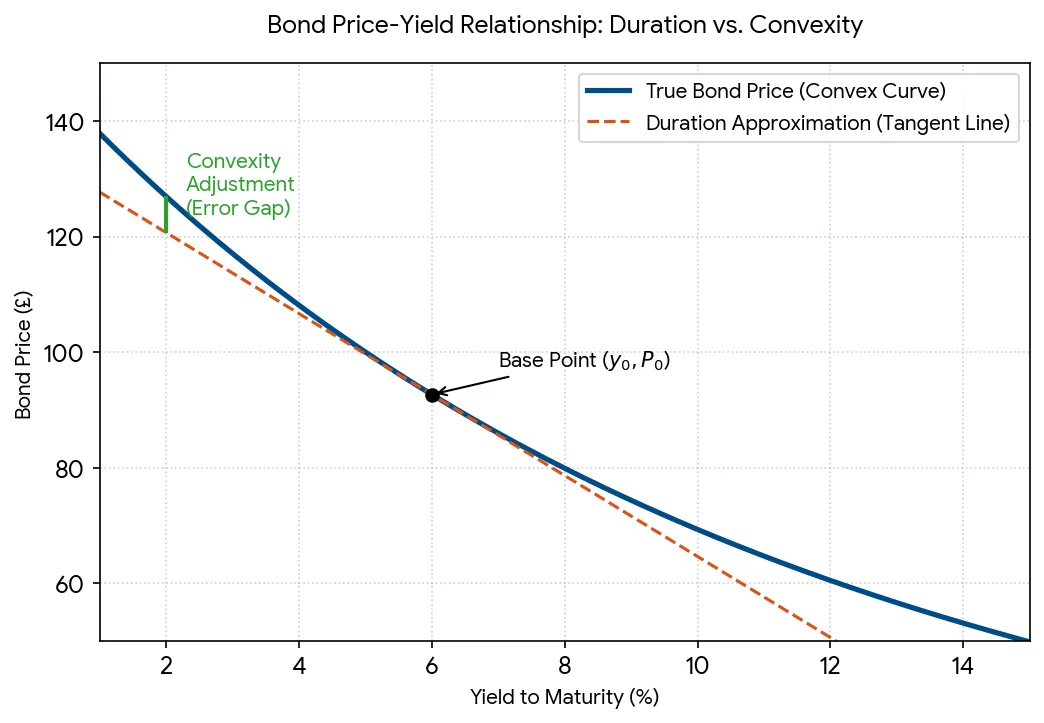
Duration-based estimates work best for small, parallel shifts in the yield curve. Tilt the ground a little, and the plank's drop stays almost exactly proportional to the tilt. Tilt it by a lot, and the response curves. Convexity is the name for that curvature, and it refines the estimate for larger moves in yields. This connects to our earlier piece, What the Treasury Yield Curve Tells Long-Term Investors.
Real yield curves rarely move in parallel either. When different maturities move by different amounts, practitioners reach for measures that isolate sensitivity at selected points along the curve, such as key rate duration.
Conclusion
Duration condenses a whole stream of future payments into one number that predicts behavior. The plank picture is all you need to remember: weights, a balance point, and a small tilt. Learn where the weights sit for any bond you hold, and the reaction of its price to rate news stops being a surprise.
This article is informational only and is not financial advice. It is a general education about a market measure, and it makes no recommendation about any security.