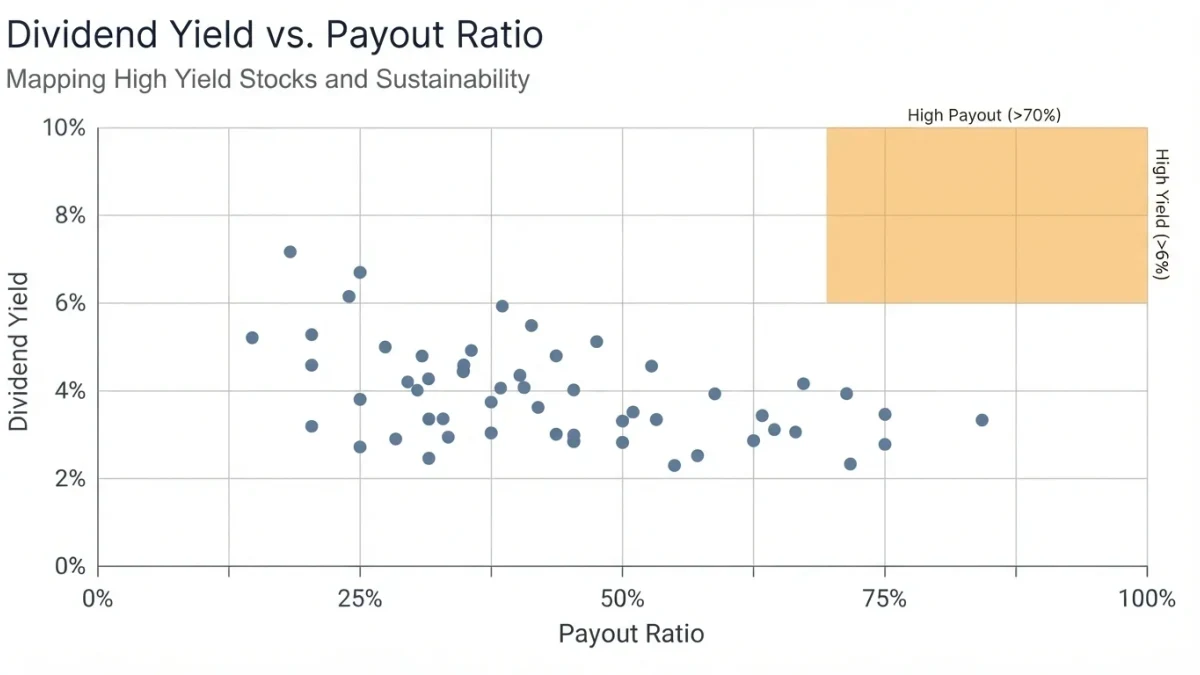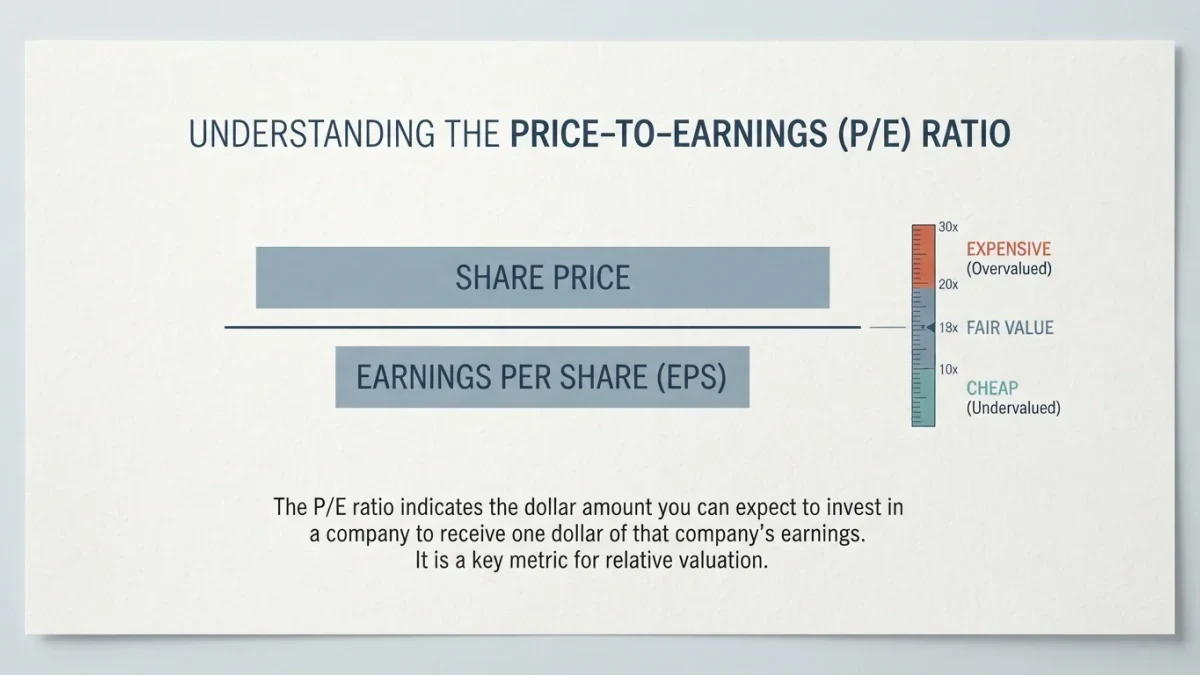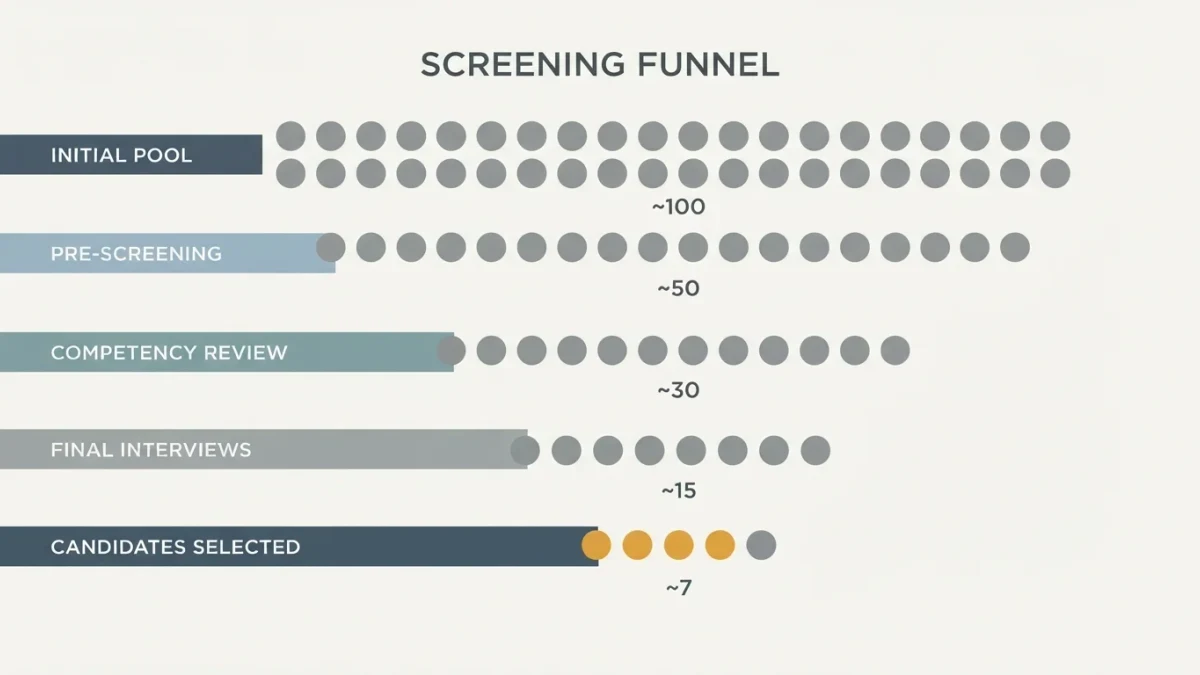
Dividend safety comes down to coverage: a payout consuming less than roughly 60-70% of earnings and, more strictly, of free cash flow leaves room for a bad year, while a payout ratio creeping above that band converts the income stream into a timing question. The working figures all come from public filings — the 10-K's cash flow statement is the honest source, because dividends are paid in cash, not in reported earnings. NewsJay publishes information and education, not investment advice, and no checklist here certifies any specific company's payout.
Why is the yield the least useful signal?
Yield is a fraction whose denominator is a falling price, which is why the highest yields cluster around the most troubled stocks — the market marks the price down precisely because it doubts the payout. A 9% yield on a stock that cuts its dividend delivers the worst of both outcomes: the income halved and the principal repriced. Treating an unusually high yield as a warning label rather than a gift is the single most useful reflex in dividend analysis.
What are the five checks?
The checklist runs in order of honesty.
- Free-cash-flow payout ratio — dividends plus buybacks against operating cash flow minus capital expenditure, the strictest coverage test
- Earnings payout ratio — dividends against net income, more forgiving because earnings include accruals
- Balance sheet room — debt maturity schedule and credit standing, since dividends are junior to every obligation
- Track record — years of payment, years of growth, and behavior in the last recession
- Peers and sector — whether the payout is normal for the business model or an outlier
What do the thresholds look like in practice?
Numbers create the temptation to mechanize, so treat the bands as review triggers, not verdicts.
| Measure | Comfortable | Review | Danger |
|---|---|---|---|
| FCF payout ratio | Under 60% | 60-80% | Above 80% or negative FCF |
| Earnings payout ratio | Under 50% | 50-70% | Above 70% sustained |
| Debt to EBITDA | Under 2x | 2-3x | Above 3x with near maturities |
| Recession behavior | Maintained or raised | Held flat | Cut in last downturn |
The bands are conventions drawn from long analyst practice, not statutes — utilities run leveraged balance sheets with stable payouts by the nature of their regulated cash flows, while a cyclical miner at a 40% payout can still be riskier than it looks.
Why does free cash flow matter more than earnings?
Because a dividend is a cash event. Earnings can include non-cash gains, capitalized costs, and one-time items; the cash flow statement reconciles reported profit against money that actually moved. A company covering its dividend in earnings terms while free cash flow runs negative is funding the payout from borrowing or asset sales — a structure that holds until the credit cycle asks its question. The reconciliation between the two statements, done once a year, catches most deteriorations quarters before the headline numbers do.
What are the classic dividend traps?
Three patterns recur. The payout that grew every year on borrowed money during easy credit, cut at the first rate shock. The one-time special dividend presented as a run rate, which capitalized yield calculations inherit as if repeatable. And the falling knife — a price collapse that doubles the optical yield while the market prices in a cut that arrives two quarters later. Each trap is visible in the checklist's numbers before it is visible in the news.
How often should the checklist be rerun?
Annually at the 10-K, and immediately after any warning-sign quarter: an FCF payout through 80%, a debt downgrade, or an abrupt CFO departure. Income portfolios fail slowly then suddenly, and the calendar review is what keeps the investor on the early side of that sequence.
How do sector dividend cultures shape the checklist?
Payouts exist inside sector norms that recalibrate every threshold: utilities and consumer staples carry high payout ratios by design, supported by regulated or highly repeatable revenues, while technology's culture of low yields and heavy buybacks means a modest-looking ratio can fund a fragile payout. REITs must distribute at least 90% of taxable income to keep their tax status, so their payout ratios run high by statute, and the right coverage test moves to free cash flow after maintenance capital. Energy and mining dividends swing with commodity cycles — the sector where the checklist's recession-behavior line earns its keep. Running the same bands across all sectors mistakes different business models for different safety; the checklist is universal, its calibration is local.
What signals precede a dividend cut?
Cuts announce themselves early to anyone reading the statements: coverage thinning for consecutive quarters, management defending the payout in increasingly emphatic language, debt drawn to fund distributions, and finally a special charge or asset sale timed to preserve the payment one more quarter. Companies telegraph distress in the order of least to most explicit, and the investor tracking coverage ratios sees the sequence quarters before the press release. The pattern's value is not prophecy — it is the chance to reassess the thesis while the question is still open.
How do special dividends and variable payouts change the analysis?
Some business models — shipping, mining, private-equity style holding companies — deliberately run variable payouts, distributing what the cycle leaves rather than defending a fixed commitment. The checklist applies with the calendar removed: coverage still matters, but over a full cycle rather than four quarters, and the payout's honesty is measured by how transparently management publishes the formula. Special dividends announced with the regular one are the format's virtue — no promise made that a bad year must keep. Investors accustomed to steady payers should price the income variability before counting the yield.
FAQ
What payout ratio is safe?
As a convention, under about 60% of free cash flow and 50% of earnings leaves genuine cushion for mature businesses. Stable regulated utilities can run higher; cyclicals deserve lower. The trend across three years tells more than any single print.
Are dividend cuts always fatal for a stock?
No. Companies that cut early and decisively often outperform those that stretch to defend a payout with leverage. The damage concentrates in stocks that paid an unsustainable yield for years — the market had priced the promise, then repriced the lie.
Do buybacks compete with dividends for the same cash?
Yes — both are payouts of the same free cash flow, and adding them gives the strictest coverage test. A company funding buybacks while its dividend coverage thins is choosing the more discretionary payout first, which is itself a signal.
Where do I find dividend history?
Payments and declarations appear in filings and on the company's investor-relations page; broker platforms tabulate histories. For analysis, the cash flow statements in successive 10-Ks are the source that cannot be reformatted.