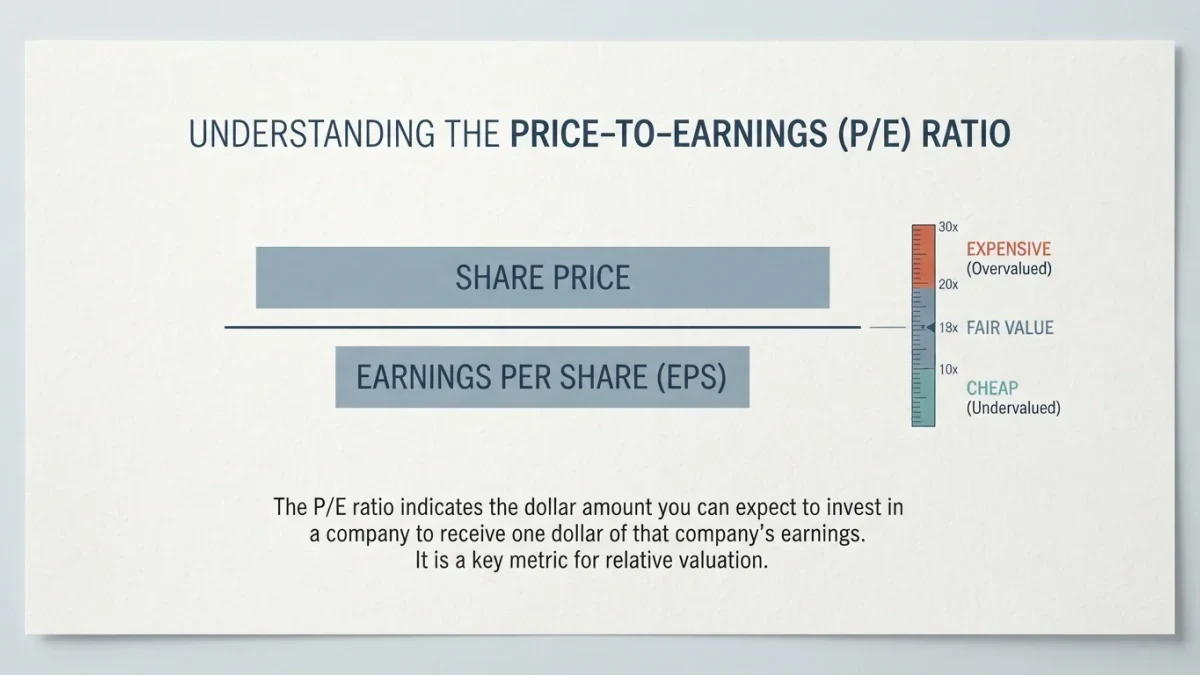
A price-to-earnings ratio of 15 means the market currently pays $15 for every $1 of the company's annual earnings — and by the long-run record of the S&P 500, whose trailing P/E has averaged in the mid-to-high teens since the 1950s, that would be an unremarkable price for the market as a whole. The ratio explains nothing on its own; it becomes information only next to the company's own history, its direct competitors, and the reason earnings stand where they do. NewsJay publishes information and education, not investment advice, and no ratio substitutes for reading the filings.
What is a price-to-earnings ratio?
The P/E ratio is a company's share price divided by its earnings per share, or equivalently its market value divided by total net income. It is a pricing unit: dollars paid per dollar of annual profit. The definition makes the two variants explicit — trailing P/E uses the last four reported quarters of earnings, while forward P/E uses analyst estimates of the coming four, which makes it a forecast dressed as a fraction. A company with no profits has no P/E at all, and that absence is itself information.
Why do sectors carry different P/E ranges?
Stable businesses with predictable earnings — utilities, consumer staples — trade at modest multiples because profits are reliable and growth is slow. Software and biotech trade higher because a dollar of today's earnings may sit atop a decade of expanding revenue, or, in the case of pre-profit firms, because the ratio is undefined and investors price the future directly. Comparing a supermarket's 12 against a software firm's 35 is a category error: the number means something only against companies with similar economics. The honest comparison set is the company's own five-to-ten-year range plus a handful of direct competitors.
What makes a P/E high or low in truth?
The ratio moves for two very different reasons: price moves, or earnings move. A falling P/E caused by collapsing earnings with a stable price is not a discount — the E shrank. A low P/E with heavy debt can be cheap for a reason, since leverage amplifies downside. And cyclical companies often look cheapest at the top of the cycle, when peak earnings compress the ratio right before the downturn resets both numbers. Reading the earnings line's quality and trajectory converts the ratio from trivia into evidence.
| Situation | Apparent P/E | What to check first |
|---|---|---|
| Ratio below own 5-year range | Cheap-looking | Is E elevated by a one-time peak? |
| Ratio above own range | Expensive-looking | Did margins or mix durably improve? |
| No P/E at all | Loss-making | Cash runway and path to profits |
| Peer set all higher | Relative discount | Debt, governance, or growth gap |
What about CAPE and the whole market's P/E?
Robert Shiller's cyclically adjusted P/E, which divides the index price by ten-year average inflation-adjusted earnings, has ranged from roughly 5 in the early 1920s to above 40 at the dot-com peak around 2000, per his Yale data. High starting CAPE values have historically been associated with lower subsequent long-run returns, and low values with higher ones — a statistical tendency over decades, not a timing tool. An investor who understands that sentence understands why market-level P/E gets quoted constantly and disciplined portfolios rarely change because of it.
How should a long-term investor use P/E at all?
Three uses survive scrutiny. As a quick screen, filtering for businesses priced reasonably against peers before deeper reading. As a red-flag check, when a ratio has doubled without a corresponding change in the business. And as an expectation-setter: at a P/E of 20, a dollar of earnings bought at today's price returns five cents a year in earnings yield, which frames what the price already assumes. What the ratio never does, in any construction, is tell you what happens next quarter.
How does the P/E relate to earnings yield and buybacks?
Inverting the ratio produces earnings yield — earnings divided by price — a 20 P/E mapping to a 5% yield, which puts equity valuation on the same scale as bond yields for rough comparison. The comparison is imperfect: earnings grow and deflate cyclically while coupons are fixed, and buybacks shift per-share figures underneath. But the frame disciplines expectations: at a given multiple, an investor's long-run return approximates the earnings yield plus growth minus dilution — the arithmetic behind every informal valuation argument, stated plainly. A buyer paying 40 times earnings needs the growth story to carry the arithmetic; a buyer at 12 needs less heroism for the same math to work.
What is the PEG ratio and does it help?
The PEG ratio divides P/E by expected earnings growth, attempting to standardize for the growth a multiple embeds — a 30 P/E with 30% growth pricing identically to a 15 P/E with 15%. Its honest uses are narrow: screening for growth priced modestly, and flagging multiples whose growth assumptions are heroic. Its weaknesses mirror forward P/E's, squared: estimates substitute for data, and the growth denominator over short horizons is noise. Treat it as a cross-check on a thesis, never as the thesis.
How do one-time items distort the E in P/E?
Reported earnings carry the residue of restructuring charges, asset write-downs, litigation settlements, and gains on sales — items the income statement presents identically to operating profit. A company showing a temporarily depressed E from a large one-time charge screens artificially expensive; the reverse flatters the ratio before the reversal arrives. The repair is reading the non-GAAP reconciliation skeptically or, better, rebuilding a normalized E from the cash flow statement and the segment notes. The discipline costs twenty minutes per company and is the difference between pricing a business and pricing an accounting event.
FAQ
What is a good P/E ratio?
There is no universal good number. The S&P 500's long-run trailing average sits in the mid-to-high teens, but utilities often trade in low double digits and software far higher. A ratio is attractive or rich only against the company's own history and genuine peers, with the earnings trend verified.
Is forward P/E better than trailing P/E?
Neither is better; they answer different questions. Trailing uses audited, reported earnings; forward embeds analyst estimates that miss systematically at turning points. Reading both shows where expectations sit — a big gap between them means the market is pricing a change already.
Can P/E be negative?
It is simply undefined for loss-making companies — dividing by a negative number produces a meaningless figure. Screens usually show such stocks as having no P/E. For them, valuation runs through revenue multiples, cash burn, and balance sheet strength instead.
Does a low P/E mean the stock is safe?
No. Cheap ratios often accompany slower growth, heavy debt, or cyclical peaks in earnings. Safety is a property of the business — margins, leverage, diversification — not of the fraction printed beside the ticker.