
A fund charging 1% a year instead of 0.05% does not cost an investor 0.95% — it compounds against the portfolio every year, and over thirty years the gap reaches about $134,000 on a hypothetical $100,000 balance growing at 6% a year before fees. Per the Investment Company Institute's 2024 fact book, the asset-weighted average expense ratio for actively managed equity mutual funds stood at 0.65% in 2023, versus 0.05% for equity index funds. NewsJay publishes information and education, not investment advice, and every figure below is a labeled hypothetical illustration with its assumptions stated.
What is an expense ratio?
An expense ratio is the annual percentage of fund assets deducted to cover management, administration, and other operating costs. The fee is taken from fund assets daily rather than billed to the investor, which is why it never appears as a line on a brokerage statement. A fund with a 0.65% expense ratio quietly removes $650 a year for every $100,000 invested, whether markets rise or fall. The US Securities and Exchange Commission requires every fund to disclose its full fee structure in the prospectus fee table, and the regulator's investor resources explain how these deductions compound against returns over time.
How do small fees compound into large losses?
Fees compound because every dollar paid in year one is gone before it can grow in years two through thirty, and the lost growth itself keeps compounding. The math is unforgiving on long horizons: the difference between a 5% and a 5.95% annual net return sounds trivial, yet over thirty years it changes the final balance by close to a quarter. The table below shows the effect using a hypothetical $100,000 initial investment, a constant 6% annual gross return, and fees deducted annually — no contributions, no taxes.
| Annual fee | Net return | Balance after 20 years | Balance after 30 years |
|---|---|---|---|
| 0.05% | 5.95% | $317,600 | $566,200 |
| 0.65% | 5.35% | $283,500 | $477,400 |
| 1.00% | 5.00% | $265,300 | $432,200 |
The 0.65% fund ends with about $89,000 less than the 0.05% fund after thirty years, and the 1% fund gives up roughly $134,000 — close to 24% of the low-fee outcome. All three results are hypothetical illustrations, not projections of any actual fund, and past or hypothetical performance never guarantees future results.
Where do you find a fund's real fee load?
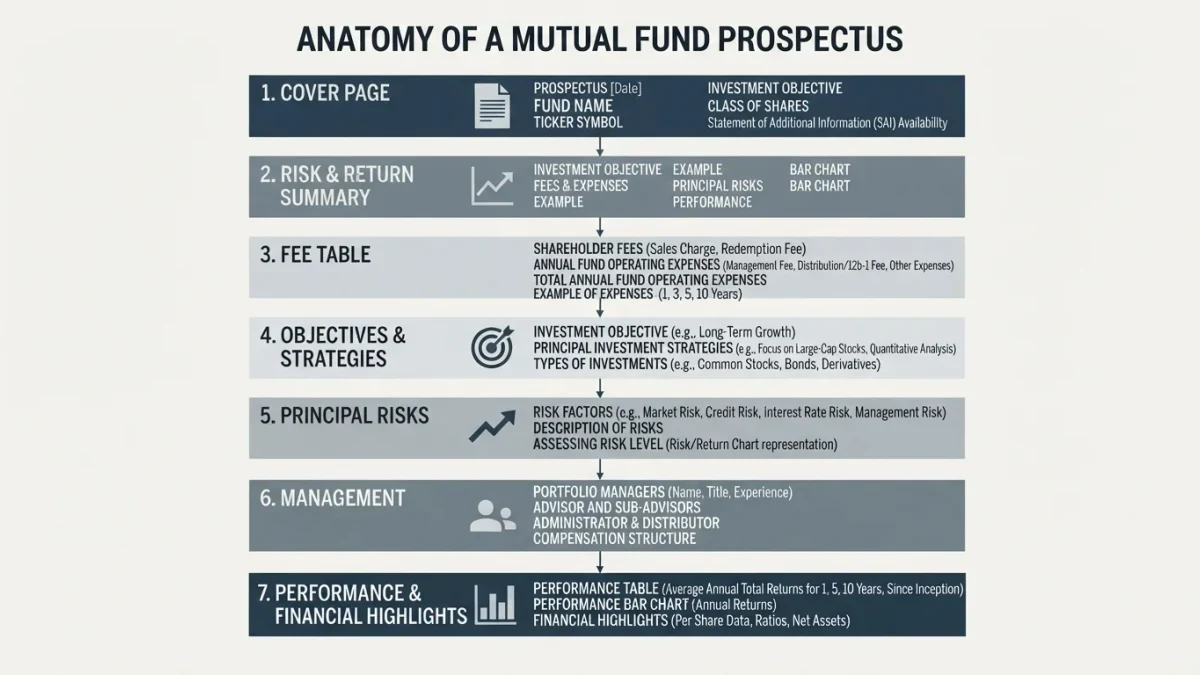
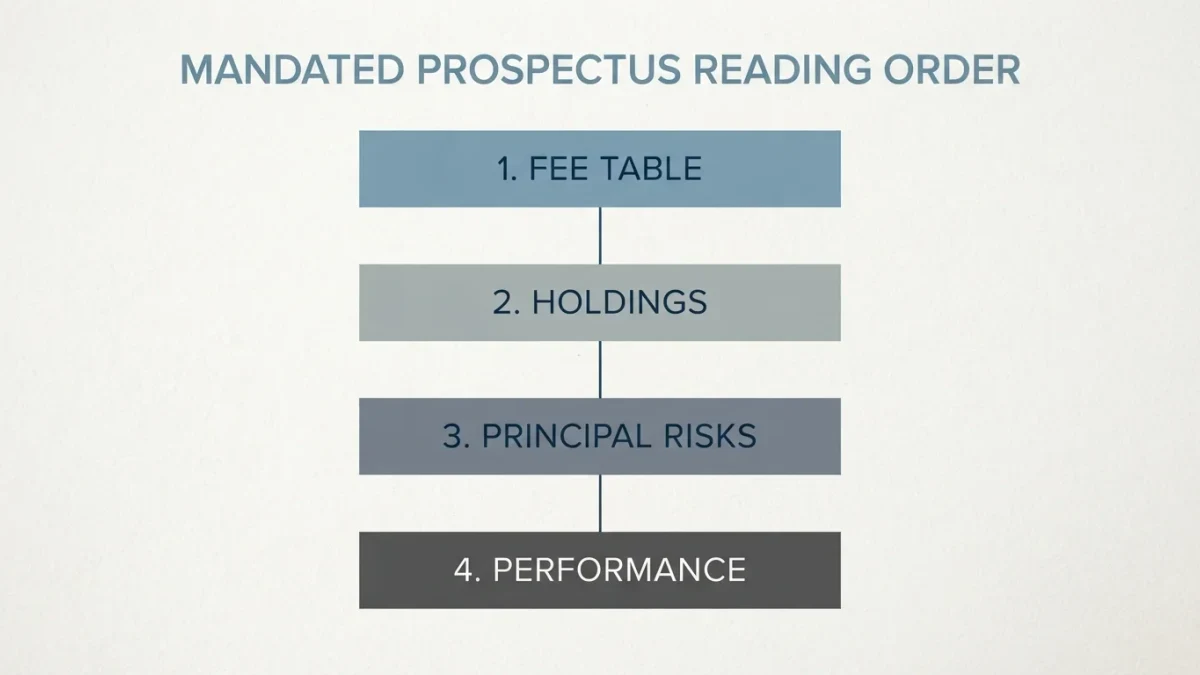
The prospectus fee table is the authoritative source, and it shows more than the headline expense ratio. It lists shareholder fees — sales loads, redemption fees, exchange fees — and annual fund operating expenses broken into management, 12b-1 distribution, and other costs. A cheap-looking fund with a 1% front-end load starts each dollar at 99 cents. Reviewing the whole table matters because a fund's own materials are the attributed source of its terms, never evidence of future results.
Does the cheapest fund always win?
Cost is the most reliable single predictor of relative performance within a category, but it is not the only variable that matters. Two funds tracking different indexes own different markets, and tracking behavior, lending programs, and tax efficiency all affect net outcomes. The disciplined comparison keeps scope constant: an S&P 500 index fund against another S&P 500 index fund, where fee differences translate almost directly into return differences. When the comparison crosses strategies, cost still matters, but methodology dominates.
How do fees interact with taxes and inflation?
Fees are one of three silent claimants on a portfolio's real return, alongside taxes and inflation, and they are the only one fully within the investor's control. In a taxable account, a fund that realizes gains adds a tax drag on top of the expense ratio; in a rising-cost decade, inflation erodes purchasing power that no fund choice can restore. An investor earning 6% gross, paying 1% in fees and 2% to inflation keeps roughly 3% a year in real spending power before taxes — the fee consumed a sixth of the gross return every single year. Framing the deduction that way explains why cost discipline ranks above almost every other decision a fund investor makes, and why the arithmetic deserves a place in the permanent file next to performance records.
What should a long-term investor actually do with this?
The practical response is an audit, not a panic. List every fund held, find each expense ratio in its prospectus, and compare it against category peers using the fee tables rather than marketing summaries. For most taxable and retirement accounts holding broad index funds, the exercise takes an hour a year and finds either reassurance or a short list of funds whose fees cannot be justified by their role in the portfolio. No piece of arithmetic, including the table above, tells anyone what to buy.
How do fees compare across account types and wrappers?
Fee discipline applies differently by wrapper. In workplace 401(k) plans, the menu is fixed and the investor's lever is choosing the cheapest option per asset class within it — plan-level administrative fees apply regardless, and disclosure statements itemize them annually. In IRAs and taxable brokerage accounts, fund selection is unconstrained, so nothing prevents choosing the category's cheapest broad funds. Exchange-traded funds and mutual funds tracking the same index differ mainly in trading mechanics, not expense; the ratio printed in the prospectus is what compounds either way. The audit that finds a 1% fund in a menu with a 0.05% alternative for the same market has done a year's work in an hour.
What about advisory fees on top of fund fees?
A separately charged adviser fee stacks on fund expenses with identical compounding mechanics: a 1% advisory fee layered over a 1% fund fee reproduces the table above at double the cost. Advisers can justify fees with planning, tax management, and behavioral coaching — services with measurable value — but the arithmetic deserves the same audit as the funds themselves. Investors paying for advice should be able to state what the fee buys and check periodically that the service arrives.
FAQ
Is a 1% expense ratio high?
For a broad-market equity index fund, yes — the category's asset-weighted average was 0.05% in 2023, per the Investment Company Institute. For actively managed equity funds, 1% sits near the 0.65% asset-weighted average but above many alternatives. The honest test is what the fee buys in strategy and diversification.
Do expense ratios apply to ETFs?
Yes. Exchange-traded funds carry expense ratios deducted from fund assets the same way mutual fund fees are. ETF fees are disclosed in the same prospectus fee table format, and broad equity index ETFs averaged roughly 0.15% asset-weighted in recent years, per industry data.
Are fees tax-deductible?
Generally not for accounts opened after the 2017 tax law suspended miscellaneous itemized deductions through 2025; fees inside tax-advantaged accounts were never separately deductible. Confirm current treatment with IRS publications or a qualified tax professional before acting.
Can I negotiate fund fees?
No — expense ratios are set by the fund, not the investor. The investor's lever is selection: choosing lower-cost funds covering the same market exposure. Brokerage commissions and advisory fees are separate negotiable costs on top of fund expenses.