
The monthly jobs report matters to a long-term investor for three numbers — payroll growth, the unemployment rate, and labor force participation — read as a trend rather than a headline, and always with attention to revisions. The US Bureau of Labor Statistics compiles it from surveys of roughly 119,000 businesses and about 60,000 households, and publishes it on the first Friday of most months at 8:30 a.m. Eastern.
What is actually in the employment situation release?
Two surveys sit inside one document. The establishment survey asks employers how many people worked and for how many hours, producing nonfarm payrolls, average hourly earnings, and overtime. The household survey asks people whether they worked, looked for work, or gave up, producing the unemployment rate and the participation rate. The two can disagree in any given month — the household survey is smaller and noisier — and both are revised as fuller data arrives, which is why any single print deserves a modest reaction.
Which numbers deserve the most attention?
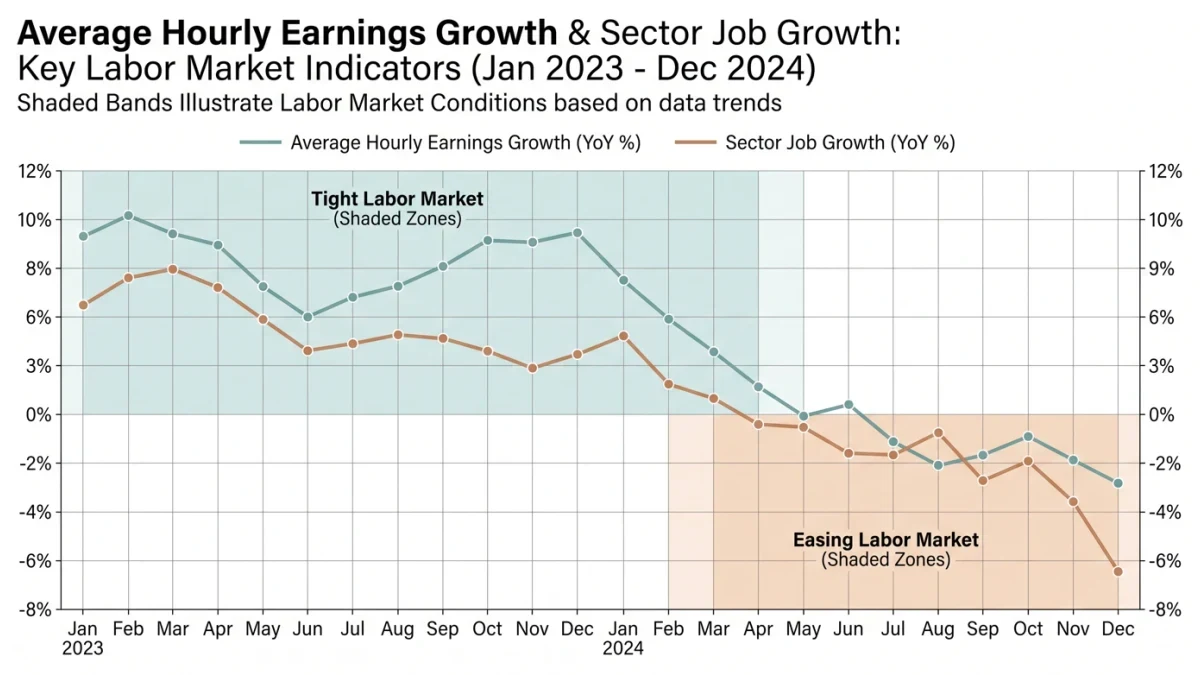
Payroll growth is the headline, but the unemployment rate with its participation denominator says more about the economy's temperature. A falling unemployment rate caused by people leaving the labor force is weaker than the same fall caused by hiring. Average hourly earnings carries the inflation signal: wage growth far above productivity growth feeds into services inflation, which central banks watch closely. The table below orders the release the way a long-horizon reader can use it.
| Indicator | What it measures | Why it matters to investors |
|---|---|---|
| Nonfarm payrolls | Net jobs added, employer survey | Growth pulse; big misses precede recessions |
| Unemployment rate | Jobless share of labor force | Headline cyclical gauge |
| Participation rate | Share of adults working or seeking work | Quality check on the unemployment rate |
| Average hourly earnings | Wage growth, employer survey | Services inflation input |
Why do revisions matter so much?
Initial estimates are replaced twice in following months as more survey responses arrive, and the changes are not trivial. A famously weak print can recover toward trend, and a blowout can fade; the benchmark revisions published annually can restate the whole year. An investor reacting to the first print is reacting to the least accurate version of the number. Reading the trend of the last three to six months, revisions included, filters most of that noise at zero cost.
How does the market usually react?
Bond markets react first, because the report feeds directly into expectations for central bank rate decisions: very strong employment and wages raise the odds of tighter policy, which pushes yields up and often pulls stock valuations down, while weak data does the reverse. Equity reactions are less mechanical — strong growth can lift earnings expectations even as it lifts rates. For a portfolio measured in decades, the honest reading is that release-day volatility is a transfer from impatient traders to patient ones, not information requiring action.
What does an evidence-based playbook say to do on jobs day?
Nothing, almost always. The durable lessons are structural: employment data confirms or contradicts the recession signals worth watching, such as the Sahm rule — which flags recession risk when the three-month average unemployment rate rises half a percentage point above its trailing low — and it feeds the inflation picture that determines real returns. A long-term investor who understands what the report contains is harder to frighten on release Friday, and staying calm is the behavior the evidence rewards.
What other labor indicators fill out the picture?
The household survey's participation rate deserves the attention it rarely gets, and two companion releases complete the month: the Job Openings and Labor Turnover Survey, published weeks later, showing whether openings and quits — the confidence indicators — are cooling ahead of the unemployment rate; and weekly initial jobless claims, the highest-frequency signal, which markets read for inflection points the monthly print confirms after the fact. A long-term investor does not track any of this daily — the value is understanding the system well enough that each release lands as confirmation rather than surprise.
FAQ
When is the jobs report released?
Usually the first Friday of the month at 8:30 a.m. Eastern, covering the prior month, on the Bureau of Labor Statistics website. Scheduling quirks around holidays occasionally shift it by a week, and government shutdowns have delayed full releases in the past.
Which number moves markets the most?
The payroll change against consensus expectations, followed closely by average hourly earnings. The surprise versus expectations, not the absolute level, drives the immediate bond and equity reaction, which is why identical prints produce different market days.
Can one bad jobs report signal a recession?
Not alone. Single-month weakness is routinely revised away, and recession signals worth their name use sustained moves — the Sahm rule's half-point threshold is measured on a three-month average. One print is a data point; three or four in one direction is a trend.