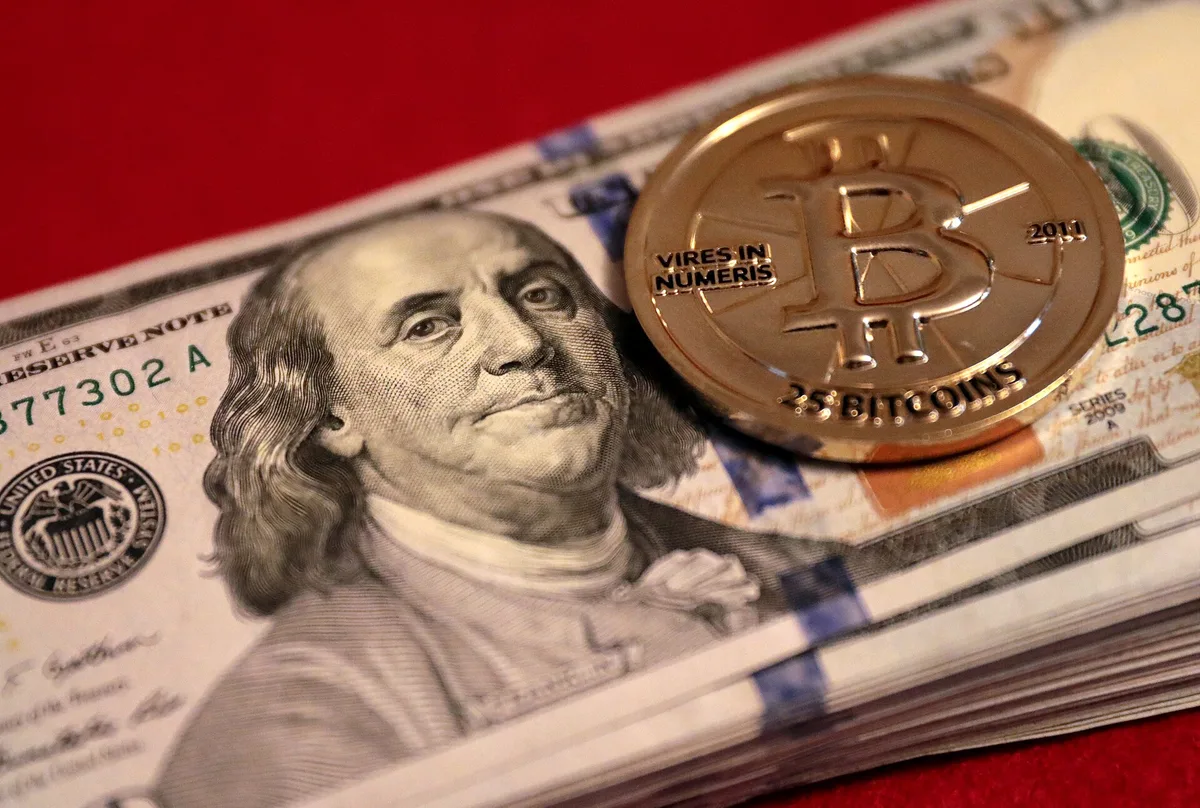

Bitcoin topped a recent comparison of ten investment assets with a 633.2% inflation-adjusted return, according to a study by the online trading platform Taurex. That figure, published in October 2026, put the cryptocurrency ahead of silver, U.S. stocks and gold over the study's holding period. The number is striking, but so is the fine print: the same report also noted a 25% decline in Bitcoin over the previous year.
For a newcomer, the study is a useful case study in how return figures get built. The comparison adjusted gains for roughly 25% cumulative U.S. inflation, so it measures changes in purchasing power rather than raw price moves. It also included dividends and interest where applicable. Those choices matter, and they explain why some familiar holdings — savings accounts, U.S. aggregate bonds and palladium — finished with negative real returns.
This explainer unpacks what the study measured, why its ranking looks the way it does, and what a long-term investing reader should weigh before treating any single ranking as a verdict. Crypto markets are volatile, and losses are possible; the study itself reported a 25% annual decline alongside its headline gain. This connects to our earlier piece, How to Start Investing With Little Money in 2026.
What does "real return" actually mean?
A real return is the gain an investment delivers after inflation is subtracted. If a holding rises 30% in price while prices across the economy rise 25%, the investor's money buys only slightly more than before. Taurex's researchers used roughly 25% cumulative U.S. inflation over the study period to make that adjustment across all ten assets, so the ranking compares purchasing power, not quoted prices.
The study also says its calculations included dividends and interest where applicable, rather than relying solely on price changes. That is why the S&P 500's figure is described as a dividend-inclusive total return. For income-paying assets, ignoring payouts would understate results; for assets that pay nothing, such as gold or Bitcoin, the adjustment changes nothing.
How did the ten assets rank?
Bitcoin led with a 633.2% cumulative real return and a reported 49% real compound annual growth rate. Silver followed at 60.7% real, then the S&P 500 at 57.3% with dividends, then gold at 55.5%. U.S. house prices ranked fifth at 18.6% real, followed by U.S. farmland at 10.4% and U.S. real estate investment trusts at 1.6%.
Three assets lost purchasing power. U.S. savings-account cash recorded a negative 18.2% real total return, and U.S. aggregate bonds and palladium also posted negative real returns in the comparison. Taurex's account of the savings figure noted that 34% of Americans hold savings accounts paying at least 4% interest — a reminder that account choice shapes even the cash result.
Why the methodology deserves a close read
The report's own explanation contains a wrinkle worth knowing. Its summary described Bitcoin's performance since 2020, while the methodology referred to both four- and five-year tracking periods. The stated holding periods therefore varied within the report's accompanying explanation. A cumulative return is highly sensitive to its start date, so that ambiguity is not a small detail.
The report also ranked assets by cumulative real return rather than latest annual performance. That choice favors Bitcoin in this instance, because the study simultaneously reported a 25% decline in Bitcoin over the previous year. Both figures can be true at once: a large gain over the full window and a loss over the most recent twelve months. Readers comparing assets should check which window any published figure uses before drawing conclusions.
Bitcoin's cumulative gain was more than 10 times silver's result, and it stood apart from the remaining positive results, which ranged from 1.6% for REITs to 60.7% for silver. When one observation sits that far from the rest of a distribution, the honest reading is that the asset behaves differently from the others — not that the others underperformed some shared standard.
What does this mean for gold, silver and stocks?
Among traditional assets, silver's 60.7% cumulative real return came with a reported 9.9% real annual growth rate. Gold posted 55.5% cumulative and 9.2% annualized after inflation. In Taurex's investment example, $10,000 invested in gold at the starting point would have purchasing power equivalent to about $15,500 in 2020 dollars.
The S&P 500 delivered a 57.3% real total return with dividends and a 9.5% real annual growth rate. Taurex put the index's nominal cumulative gain at approximately 96%. Over the five calendar years discussed, U.S. shares rose in four — including gains of about 29% in 2021 and 25% in 2024 — with 2022 the losing year at approximately 18%. That pattern of steady, dividend-supported compounding is the mechanism behind long-horizon stock results; readers can see the arithmetic worked through in What Compounding Actually Looks Like in an Index Fund.
What does recent market news add to the picture?
The study lands amid mixed signals in the markets. In late July, according to crypto.news, Bitcoin gained 1.2% to around $64,804 following the June U.S. inflation release, while the S&P 500 rose approximately 0.9% in early trading, gold added about 0.3% to $4,076 per ounce, and silver gained 0.6% to roughly $58.
In August, coverage of Bitcoin's muted response to the July consumer price index reported annual headline inflation of 3.4% and a monthly increase of 0.1%. Bitcoin moved from roughly $63,800 to $64,100 over four hours, a gain of about 0.47%. The same report recorded $854 million in U.S. spot Bitcoin ETF inflows during the first week of August, perpetual futures activity at a three-year low ahead of the CPI release, and options markets pricing an expected Bitcoin move of only 1.3%.
Demand signals have not all pointed one way. In May, JPMorgan analysts led by Nikolaos Panigirtzoglou described outflows from ETFs tracking both Bitcoin and gold over the preceding two weeks, alongside weaker institutional positioning in CME futures. "It is not a case of Bitcoin funds shifting to gold; rather, both asset classes are facing a simultaneous decline in demand," the bank said. Episodes like that one are why the study's long-window framing and its 25% annual decline figure need to be read together.
What should a long-term investor take from the study?
The evidence here establishes one narrow thing: over the period Taurex studied, with its roughly 25% inflation adjustment, Bitcoin's cumulative real return exceeded nine other assets, while cash, bonds and palladium lost purchasing power. It does not establish what any asset will do next, and the report's inconsistent holding-period language limits how precisely the result can be pinned to a window.
What remains unknown is equally important: the study is a platform's comparison, not a peer-reviewed analysis, and past performance — labeled as such throughout — never projects forward. For readers building portfolios around costs, diversification and holding periods, a single-window ranking is context, not a playbook. Those weighing how new holdings might fit an existing mix may find portfolios guidance more durable than any leaderboard, and the day-to-day moves behind these figures are tracked in Markets News.